Online dating apps have revolutionized how people meet and form relationships. From early matchmaking services to today’s advanced platforms using AI and geo location, the journey of dating apps is fascinating. In 2024, these apps will be more popular than ever, providing valuable insights into user demographics, usage patterns, and success rates. This article delves deep into these aspects to give you a comprehensive understanding of the world of the online dating industry.
The Rise of Dating Apps
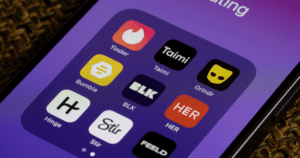
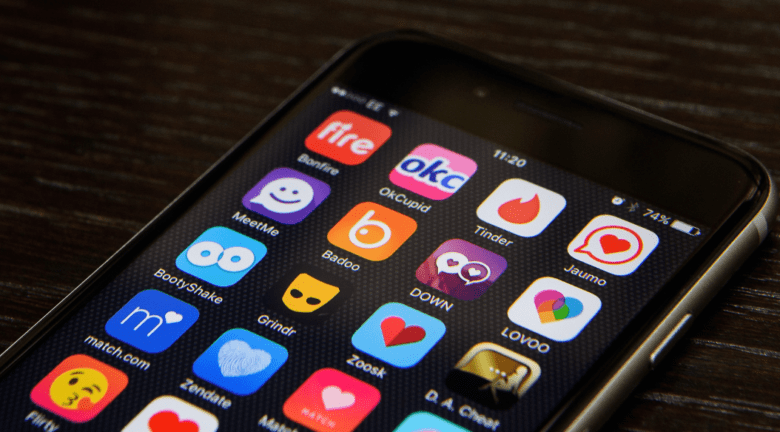
Online dating began with simple matchmaking services, evolving into sophisticated online dating platforms like Tinder, Bumble, and Hinge. These platforms utilize smartphones and geo location to match users based on proximity and preferences, making it easier to find potential partners nearby. Early dating apps focused on algorithms and questionnaires, but modern apps offer a more interactive experience, allowing users to swipe right or left to express interest in the dating world.
Key Dating App Statistics in the Online Dating Industry
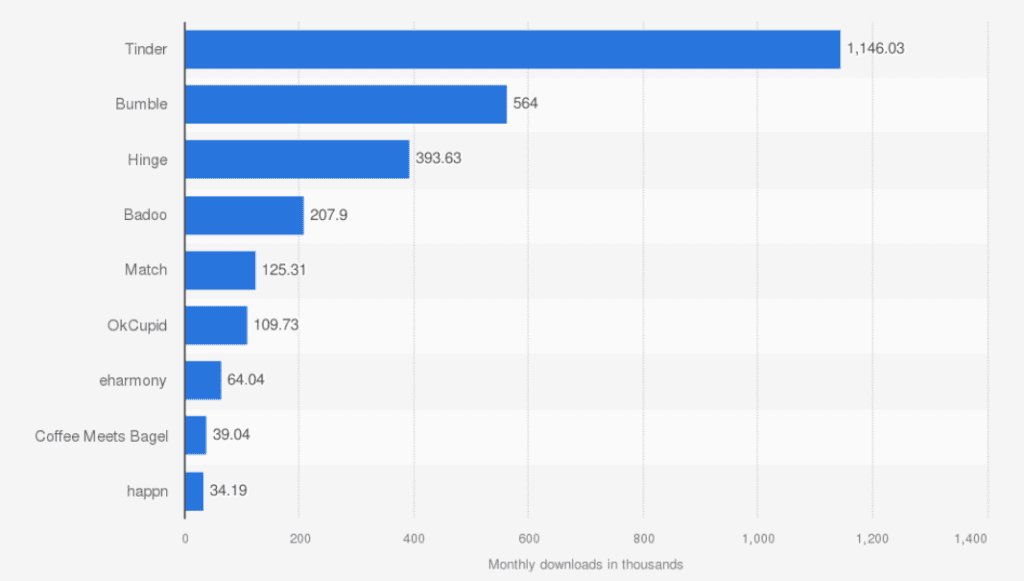
Dating statistics show that the online dating industry has seen exponential growth in the past decade. With millions of users worldwide, dating apps generate billions in revenue through subscriptions, in-app purchases, and advertising. Popular dating apps like Tinder and Bumble report annual revenues in the hundreds of millions, showcasing the financial impact of this industry. According to dating app statistics, the market is expected to grow, with more users joining yearly. In 2024, the estimated revenue for the online dating industry is projected to reach $3.46 billion, reflecting its significant economic footprint.
Age Demographics in Dating Apps
Here is a breakdown of the age demographics of users on popular dating apps:
| Age Group | Percentage of Users | Most Popular Apps | Preferences and Trends |
| 18-29 | 53% | Tinder, Bumble | Prefers casual dating, fast interaction, and mobile first apps |
| 30-39 | 37% | Hinge, Bumble | Seeks both casual and serious relationships, values detailed profiles |
| 40-49 | 20% | Match.com, eHarmony | Prefers serious relationships, values compatibility, and detailed bios |
| 50-64 | 13% | eHarmony, Match.com | Looks for long term relationships, higher trust in established brands |
| 65+ | 8% | OurTime, SilverSingles | Focuses on companionship and serious relationships, prefers age specific apps |
Younger Demographics
Online daters in their early 20s to 30s dominate the dating app market. These age groups are tech savvy and open to using digital platforms for dating. They use dating sites like Tinder and Bumble because they are user friendly interfaces and large user base. According to recent online dating statistics, 53% of Tinder users are between 18 and 29 years old. This demographic values the convenience and immediacy that these online dating services offer.
Older Demographics
Interestingly, older generations (40s and above) are also increasingly using dating apps. This shift reflects broader cultural changes and the growing acceptance of technology among older adults. Apps like eHarmony and Match.com cater to this demographic, offering features that appeal to users seeking serious relationships. Dating app statistics indicate that 20% of adults aged 50-64 have used dating apps, showcasing the expanding reach across different age groups.
Gender Ratios and LGBTQ+ Community Usage in Online Dating Apps
Understanding the gender ratios and the usage patterns of the LGBTQ+ community in online dating apps is essential for a comprehensive view of the online dating industry. Here are the key insights:
Gender Ratios in Dating Apps:
-
Tinder:
- Gender Ratio: Approximately 60% male, 40% female
- Trends: Higher activity and more matches for female users
- User Behavior: Men tend to swipe right more often than women
-
Bumble:
- Gender Ratio: More balanced with around 55% male and 45% female
- Unique Feature: Women initiate conversations, leading to a safer and more respectful environment for female users
- Success Rates: Higher match rates for women due to control over initiating contact
-
Hinge:
- Gender Ratio: Close to even, with slight male predominance
- User Engagement: Emphasis on meaningful connections and detailed profiles
- Preferences: Both genders value in-depth bios and common interests
-
eHarmony:
- Gender Ratio: Approximately 52% female, 48% male
- User Base: Older demographics seeking serious relationships
- Dating Preferences: High focus on compatibility and long term potential
LGBTQ+ Community Usage in Dating Apps:
-
Grindr:
- Target Audience: Gay, bisexual, and transgender men
- Community Features: Location based matching, high user engagement
- Success Rates: Known for facilitating quick connections and meet ups
-
HER:
- Target Audience: Lesbian, bisexual, and queer women
- Unique Features: Community events, social networking, and dating
- User Experience: Safe space for women, with emphasis on inclusivity and support
-
Tinder and Bumble:
- Inclusivity: Options to specify a wide range of gender identities and sexual orientations
- Usage Patterns: Increasingly popular among the LGBTQ+ community for casual and serious relationships
- Success Rates: High engagement due to diverse user base and inclusive features
-
OkCupid:
- Gender and Orientation Options: Extensive options for gender identities and sexual orientations
- User Preferences: Detailed profiles and compatibility questions cater to a broad spectrum of users
- Community: Strong LGBTQ+ presence, with features supporting inclusivity
-
Match.com:
- LGBTQ+ Features: Welcomes all sexual orientations and gender identities
- User Base: Predominantly older users seeking serious relationships
- Dating Behavior: Emphasis on compatibility and detailed profile information
Geographic Distribution of Dating App Users in the Dating App Industry
The geographic distribution of dating app users varies significantly. Urban areas have higher numbers of users due to larger populations and greater acceptance of digital dating, with Tinder, Bumble, and Hinge being the most popular. Rural areas have fewer users, who often prefer apps like Match.com and eHarmony for serious relationships.
Internationally, in the United States, about 30% of adults use dating apps, with similar rates in the UK. Canada and Australia also have high usage, especially among younger users. In India, usage is rapidly growing, particularly in urban areas, with Tinder, Bumble, and Badoo leading the market.
Here is a breakdown of the geographic distribution of dating app users:
| Region | Penetration Rate | Popular Apps | User Demographics |
| United States | 30% | Tinder, Bumble, Match.com | Diverse, all age groups, strong LGBTQ+ presence |
| United Kingdom | 28% | Tinder, Bumble, Hinge | Young and diverse, similar to the U.S. |
| Canada | 27% | Tinder, Bumble, eHarmony | High engagement among younger users |
| Australia | 25% | Tinder, Bumble, Hinge | Predominantly younger users |
| India | Rapid Growth | Tinder, Bumble, Badoo | Young, tech savvy, significant male user base |
| Urban Areas | High | Tinder, Bumble, Hinge | High density, frequent multiple app usage |
| Rural Areas | Low | Match.com, eHarmony | Less frequent usage, preference for serious relationships |
Usage Patterns in Popular Dating Apps
Usage patterns in dating apps reveal significant insights into user behavior and preferences. Users typically log in multiple times a day, with peak activity in the evenings and on weekends. Younger users, especially those on Tinder and Bumble, engage more frequently, while older users on apps like eHarmony and Match.com have more measured activity.
Key factors influencing dating app usage include the ease of use, the ability to swipe through profiles quickly, and features like messaging and profile customization. Detailed profiles with high-quality photos and engaging bios tend to attract more interactions. Additionally, users often employ multiple apps simultaneously to increase their chances of finding a match.
Here is a breakdown of usage patterns across different dating apps:
| App | Peak Usage Times | Frequency of Use | User Preferences |
| Tinder | Evenings, Weekends | Multiple times daily | Casual dating, quick swipes, high engagement |
| Bumble | Evenings, Weekends | Multiple times daily | Women initiate contact, detailed profiles valued |
| Hinge | Evenings, Weekends | Several times a week | Meaningful connections, in depth profiles |
| Match.com | Evenings, Weekends | Several times a week | Serious relationships, detailed bios, older users |
| eHarmony | Evenings, Weekends | A few times a week | Long term relationships, compatibility focus |
Conclusion: The Future of Online Dating in the United States
The online dating industry is thriving, with a diverse user base and innovative technologies driving its growth. Understanding user demographics, usage patterns, and success rates is crucial for anyone looking to navigate this digital dating landscape. The continuous evolution of dating apps reflects changing societal norms and technological advancements.